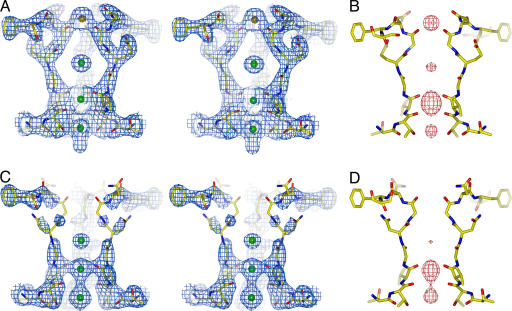
Fig. 2.
Structural analysis of NaK D66E and D66N mutants. (A) Stereoview of a 2Fo − Fc map (1.5 σ) of D66E at the filter region. The bound Ca2+ ion is modeled as an orange sphere. (B) An Fo − Fc ion omit map (8 σ) at the D66E filter. (C) Stereoview of a 2Fo − Fc map (1.5 σ) of D66N at the filter region. (D) An Fo − Fc ion omit map (8 σ) at the D66N filter.

