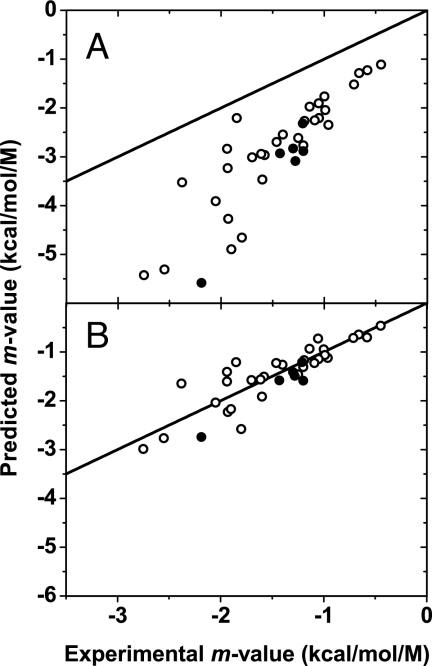
Fig. 2.
Predicted versus experimentally determined m values. The proteins represented are listed in the SI Appendix. Disulfide-containing proteins are represented as filled circles. The identity line is shown for comparison. Predicted m values were obtained by using GTFEtr,iapp values (A) and the corrected GTFE*tr,i values (B) as explained in the text.

