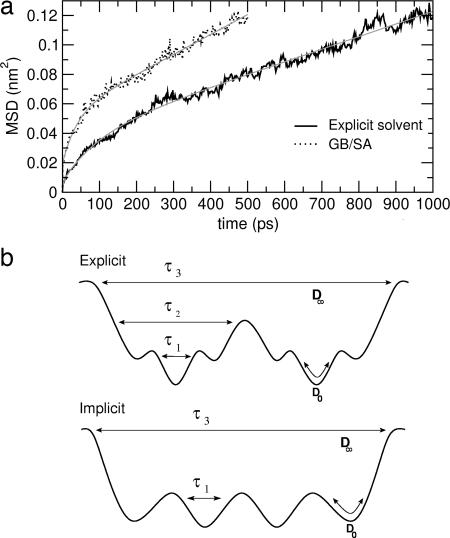
Fig. 5.
Dynamics. (a) Mean square displacement, as a function of time, along the main conformational coordinate, q, which is the eigenvector with the highest eigenvalue obtained by diagonalizing the covariance matrix of positional fluctuations of the 15 Cα atoms of the peptide (black line). The fit of Eq. 1 is also shown (gray curves). The correlation coefficients are >0.992. (b) Schematic drawing of the potential energy surface for the explicit (Upper) and implicit (Lower) solvent systems, with associated model parameters evaluated from Eq. 1.

