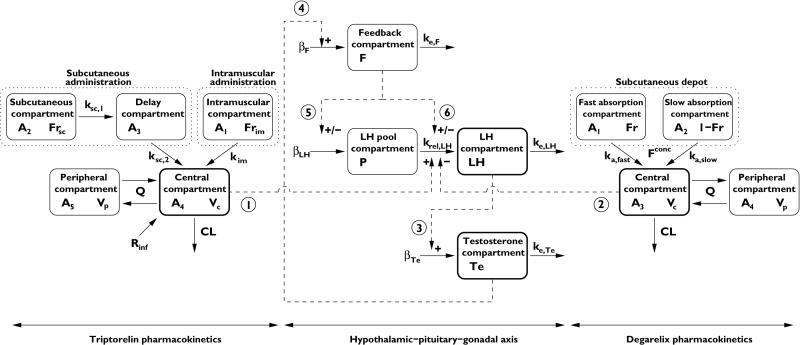
Figure 2.
Schematic illustration of the PK/PD model of the hypothalamic–pituitary–gonadal axis following treatment with the gonadotropin-releasing hormone (GnRH) agonist triptorelin and the GnRH receptor blocker degarelix. Compartments with thick black lines are those where data are available. Interactions are symbolized by dashed lines, where ‘+/–’ indicates a positive or negative interaction, respectively. The dotted lines represent a drug depot. The model parameters and numbered interactions are explained in the text

