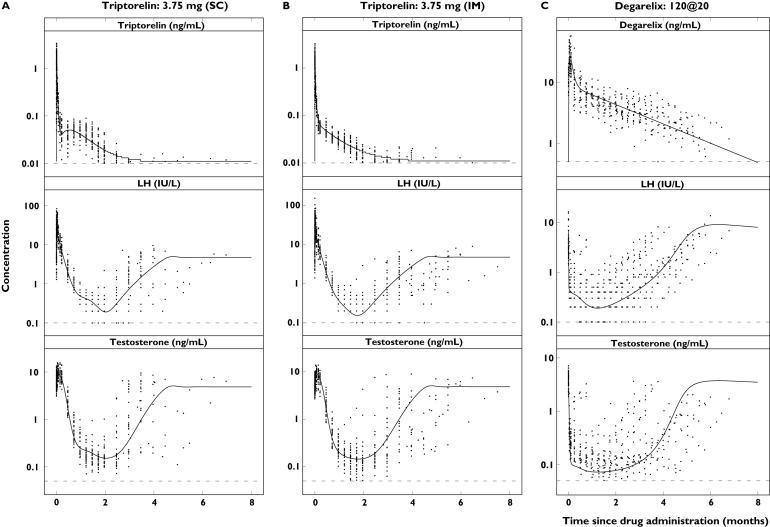
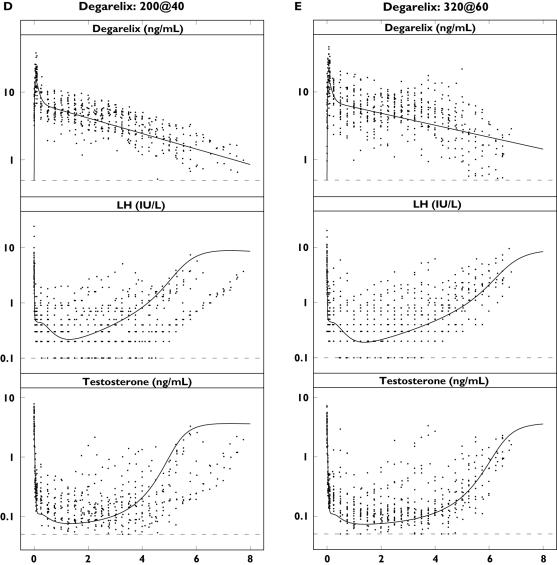
Figure 4.
Single-dose concentration–time profiles of triptorelin or degarelix (top), luteinizing hormone (LH) (middle) and testosterone (bottom) in the different dose groups plotted on a semilogarithmic scale. Observations (·) and population predictions (–). The horizontal dashed lines represent the lower limit of quantification (LLOQ) of 0.01 ng ml−1 (triptorelin), 0.5 ng ml−1 (degarelix), 0.1 IU l−1 (LH) and 0.05 ng ml−1 (testosterone)


