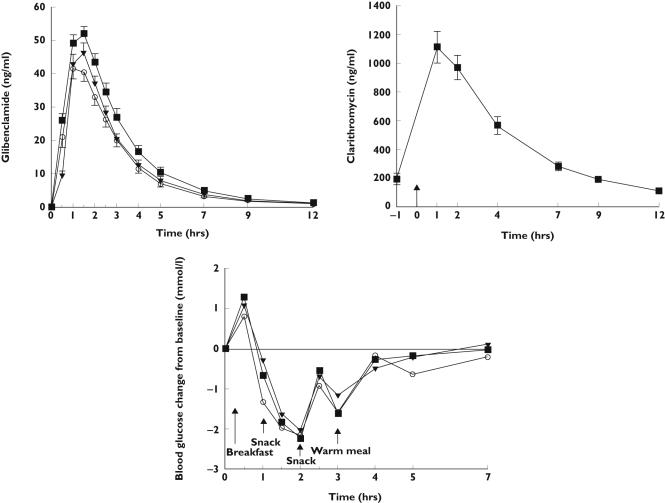
Figure 2.
Upper panel Mean ± SEM plasma concentrations of glibenclamide after single oral doses of 0.875 mg glibenclamide in 12 healthy volunteers. Glibenclamide was taken after 3 days of pretreatment with clarithromycin 250 mg twice a day (▪) or placebo (○) or after ingestion of 200 ml grapefruit juice 3 times a day (▾). Middle panel Mean ± SEM plasma concentrations of clarithromycin on day of glibenclamide administration (↑ shows the time of glibenclamide administration). Lower panel Mean change in blood glucose after administration of glibenclamide during clarithromycin phase (▪), placebo phase (○), and grapefruit juice phase (▾)

