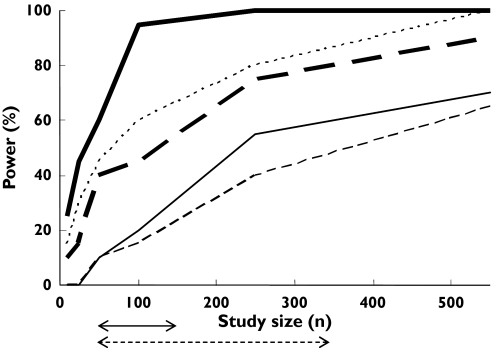
Figure 3.
Outcomes of simulations to determine the statistical power of pharmacokinetic (PK) and pharmacodynamic (PD) studies of (S)-warfarin to detect differences between the influence of the CYP2C9 wild-type genotype and the combination of all other CYP2C9 genotypes (‘random recruitment’ conditions). Power with respect to the following conditions is indicated: AUC (‘uniform dosage’ ( ) and ‘genotype-adjusted dosage’ (
 )); AUEC (‘uniform dosage’ (
 ) and ‘genotype-adjusted dosage’ (
 )); AUEC (‘uniform dosage’ and reduced PD variability (
 ) due to knowledge of VKORC1 genotype). The broken arrow indicates the range of sizes of published PD studies and the solid arrow shows the range of sizes of published PK studies

