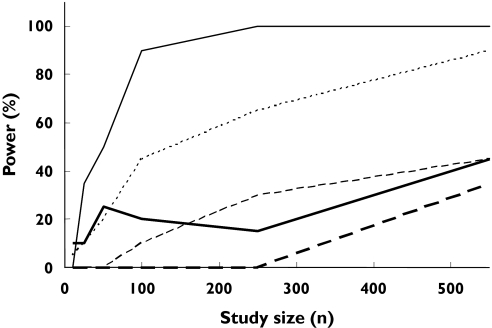
Figure 4.
Outcomes of simulations to determine the statistical power of pharmacokinetic studies of (S)-warfarin to detect differences between AUC in wild-type vs.*1/*2 ( 20.4), *1/*3 (
 11.6), *2/*2 (
 0.9), *2/*3 (
 1.4) and *3/*3 (
 0.4) genotypes under conditions of ‘uniform dosage’ and ‘random recruitment’

