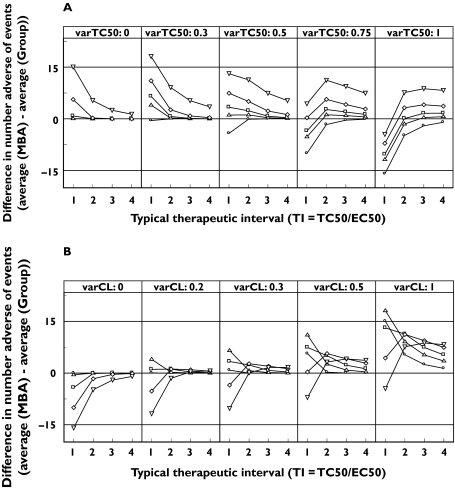
Figure 4.
The difference in number of adverse events vs. the size of therapeutic interval (TI = TC50/EC50) between a randomized dose-controlled trial (RDCT) with model-based analysis (MBA) with biomarker as independent variable and a randomized concentration-controlled trial (RCCT) with group-wise analysis. The graphs are conditioned on variability in (a) TC50 ( , 0 varCL;
  , 0.2 varCL;
  , 0.3 varCL;
  , 0.5 varCL;
  , 0 varTC50) and (b) CL (
 , 0 varTC50;
  , 0.3 varTC50;
  , 0.5 varTC50;
  , 0.75 varTC50;
  , 1 varTC50). The variability is noted as the CV.

