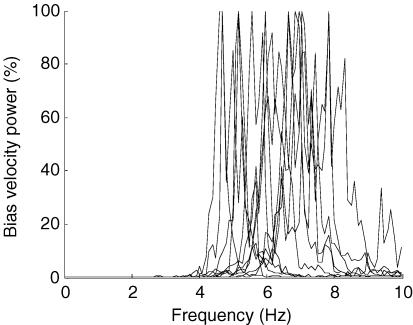
Figure 6. The maximum frequency of joystick oscillation.
The bias (joystick) velocity power spectrum is shown for 30 s of sustained oscillation at the maximum frequency that the subject could manage. Each dashed line is the spectrum for one subject, normalized to a peak power of 100%. This figure shows that the ‘manual-joystick’ bandwidth is of the order of 6 Hz

