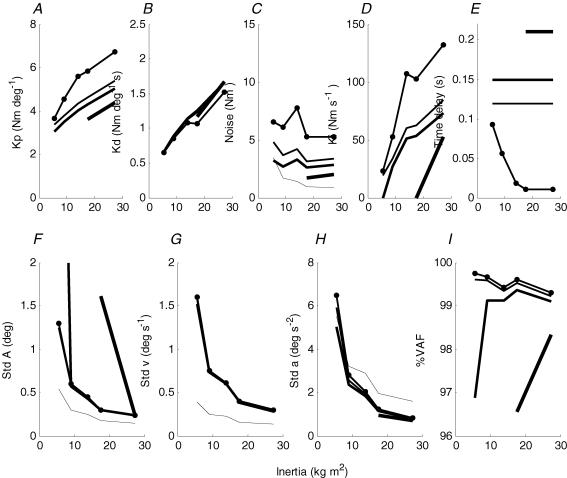
Figure 7. Optimized parameters of PID model simulating inverted pendulum velocity spectra.
A, proportional gain; B, differential gain; C, noise amplitude shown as standard deviation of noise torque; D, integral gain; E, time delay; F–H, inverted pendulum sway shown as standard deviation of inverted pendulum angle, velocity and acceleration, respectively; I, variance accounted for by model. Continuous lines in increasing thickness represent time delays of 0, 120, 150 and 210 ms, respectively, with only two largest values of inertia shown for 210 ms. Continuous line with dots shows time delay optimized as well as gain and noise amplitude parameters. In C, dashed line represents control torque standard deviation for 120 ms delay. In F–H, dashed line represents position, velocity and acceleration noise standard deviation for 120 ms delay.

