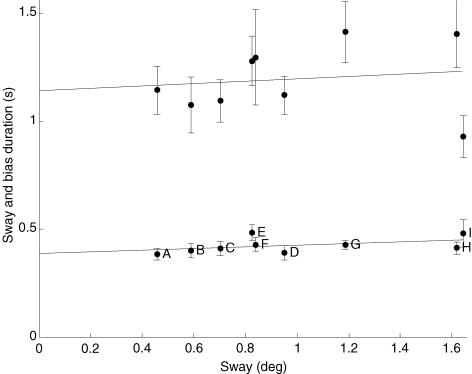
Figure 5. Sway duration and bias duration plotted against sway size.
Mean values are shown for 10 subjects in three trials. The bars indicate 95% confidence intervals. The gradient of the linear regression line for bias duration is y = 0.038x + 0.386; r2 = 0.20, P = 0.226. Sway duration is also shown. The gradient of the linear regression line for sway duration is y = 0.0554x + 1.14, r2 = 0.02, P = 0.712. The letters correspond to the sensory conditions summarized in Table 2.

