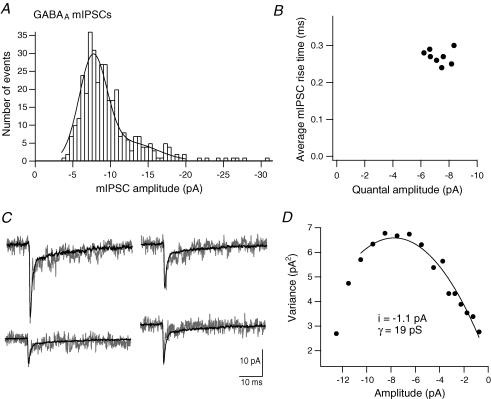
Figure 3. Single-channel properties underlying GABAA receptor IPSCs.
A, the mIPSC amplitude histogram for one terminal in the presence of TPMPA (50 μm) fitted with the sum of two Gaussians (first mean, −7.6 pA; second mean, −13.6 pA). B, average mIPSC 10–90% rise time versus quantal amplitude (peak of mIPSC amplitude histogram) for eight terminals. C, example mIPSCs from the terminal in A, with the peak-scaled average mIPSC superimposed for noise analysis. D, plot of mean current variance versus amplitude for this terminal. The curve was fitted to yield an estimate of single-channel current (i).

