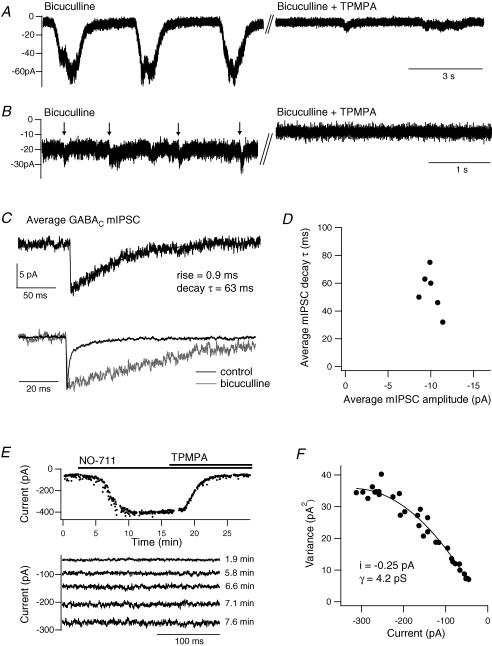
Figure 4. Single-channel properties underlying GABAC receptor currents.
A, example traces showing the slow current oscillations in the presence of bicuculline (25 μm) and their inhibition by a high concentration of TPMPA (200 μm). B, in some terminals, small synaptic currents (marked by arrows) were observed within the tonic current. They were inhibited by TPMPA (50 μm). C, the average GABAC mIPSC in the presence of bicuculline (50 μm) in one terminal (n = 16). Only events with a single, fast rising phase were included. Below, the GABAC mIPSC is peak scaled and superimposed with the GABAA mIPSC from the same terminal prior to application of bicuculline (n = 180). D, average mIPSC decay time constant versus peak amplitude for six terminals. E, mean current amplitude versus time for a terminal in the presence of bicuculline (25 μm), showing the potentiation of the tonic current by NO-711 (3 μm) and subsequent inhibition by TPMPA (100 μm). Below are example current traces from selected time points during the potentiation. F, current variance versus amplitude for the terminal in E, fitted to yield an estimate of single-channel current (i).

