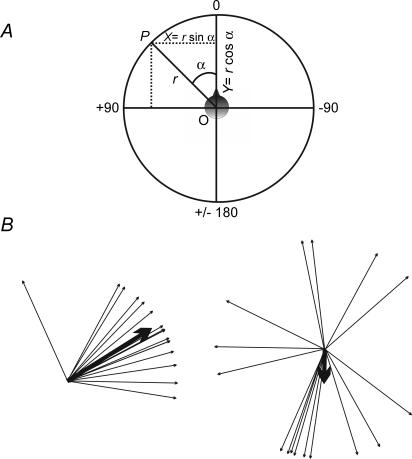
Figure 1. Representation of circular data.
A, convention used in representing angular data. B, example of a non-random distribution (left; r = 0.88, P < 0.001) and a random distribution of angles (right; r = 0.27, P = 0.3). The mean angles and their concentration (r) are shown by the direction and length of the thicker arrows.

