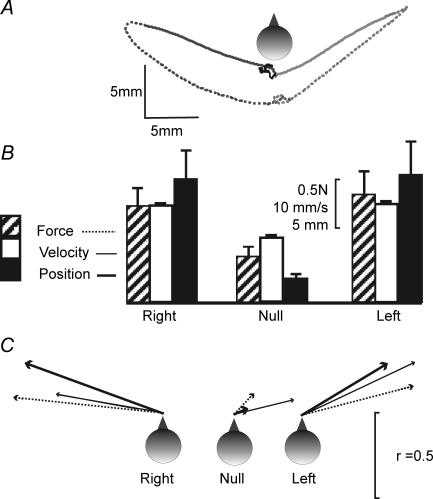
Figure 3. Effect of side of stimulation.
Data from mean responses in 10 subjects facing forward. A, group mean sway paths of the C7 marker during stimulation (continuous line) and 2 s post stimulus (dashed line) for 3 stimulus conditions [left (light grey), right (dark grey), null (black)]. B, mean (+s.e.m.) magnitude of the initial force response, peak velocity and position change during the 2 s stimulation period for right, left and null stimuli. C, mean directions of force (dotted line), velocity (thin continuous line) and position (thick continuous line). The direction of each arrow represents the mean angle and the arrow length represents r, a measure of concentration of the directions for each condition (r = 1 if all subjects respond in the same direction; see Statistical methods).

