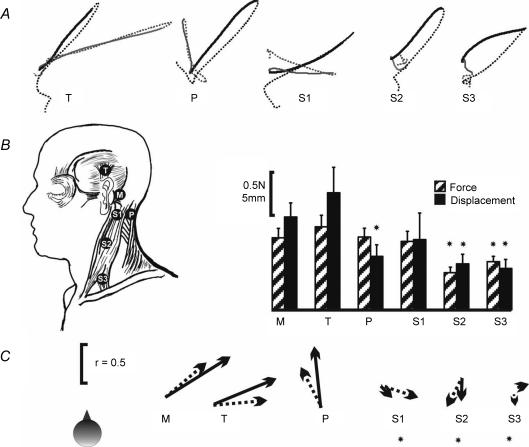
Figure 5. Comparison of skull and muscle vibration.
A, group mean (n = 16) sway paths described by the C7 marker during the 2 s of stimulation (continuous line) and 2 s after stimulus cessation (dashed line), when the stimulus was applied over the left mastoid (M: black traces) or one of 5 alternative left-sided sites (grey traces): T, temporal fossa; P over the posterior neck muscles; S1, upper 1/3 of the SCM, 1 cm below the mastoid; S2, middle 1/3 of the SCM, over the muscle belly; S3, lower 1/3 of the SCM over the clavicular head. B, mean (+s.e.m.) magnitudes of the force (hatched bars) and position change (black bars) for the 6 stimulus locations. Magnitudes that were significantly reduced compared with the mastoid are marked with an asterisk. C, mean directions of force (dotted arrow) and position (continuous arrow) responses. The direction of each arrow represents the mean angle and the arrow length represents r, a measure of concentration of the directions (r = 1 if all subjects respond in the same direction; see Statistical methods). Note the similarity in the directions of force and displacement for mastoid and temporal fossa stimulation. Angles for S1–3 were randomly distributed between subjects and are marked with an asterisk.

