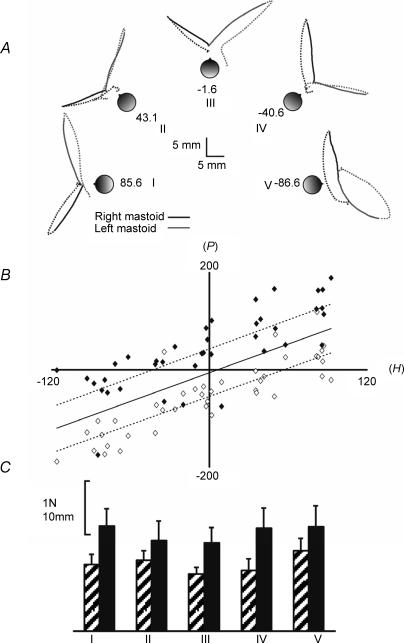
Figure 6.
Effect of head direction A, group mean (n = 8) paths taken by the C7 marker during 2 s of stimulation (bold lines) and 2 s following stimulus cessation (dashed lines) for left (grey) and right (black) mastoid stimulation. Subjects' feet were always aligned to the sagittal plane. The naso-occipital axes were aligned to angles of +90, +45, 0, −45 and −90 deg from the saggital plane (conditions I–V). The values noted for conditions I–V represent the average angle of the naso-occipital axes in the 8 subjects. B, scatterplot of the direction of position change (P) against head yaw angle (H) during stimulation. Angles relating to right- and left-sided stimulation are marked black and white, respectively. The regression lines for left- or right-sided stimulation alone (interrupted lines) and for both sides combined (continuous line) have been plotted. C, mean (+s.e.m.) magnitudes of the initial force response (hatched bars) and position response (filled bars) for the 5 head positions. No significant effect of head position was observed.

