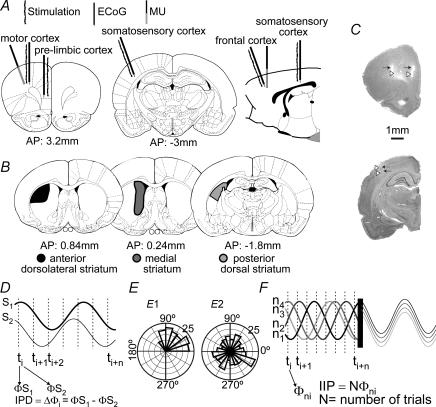
Figure 1. Simultaneous cortical and striatal recordings.
Schematic drawings of coronal and sagittal brain sections (Paxinos & Watson, 1997) displaying the position of cortical (A) and striatal (B) recording and stimulation sites. C, photographs of Nissl-stained sections depicting tracks of recording (white arrowheads) and stimulation (black arrows) electrodes in cortical structures. D, instantaneous phase differences (IPD) between two signals were calculated for every sampling interval during a defined time window. The dispersion of IPD circular distribution was taken as an index of coupling. Here, two sinusoidal waveforms were used to illustrate how IPDs were computed. Note that this does not mean that slow waves are sinusoidal (real slow waves can be seen in Fig. 2). E, throughout this paper, data are represented in circular distributions. Here, two polar plots illustrate prototypical uniform (right) and non-uniform (left) circular distributions. F, in order to estimate stimulus phase locking for a number of stimulation trials (N), trials were aligned to the stimulus time and instantaneous phases at any sampling interval along N trials were computed. This is illustrated here with overlapping episodes of an artificial sinusoidal waveform. The circular distribution of instantaneous phases at a given post-stimulus time (IIP: intertrial instantaneous phase) should be non-uniform if there is stimulus locking. Φi, instantaneous phase; Φni, instantaneous phase of individual trial; ti, sampling interval; ni, trial number; N, number of trials.

