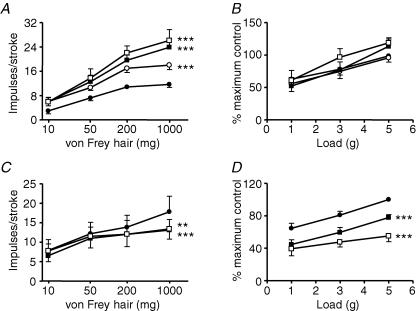
Figure 3. The effect of NMDA and AP-5 on mouse gastro-oesophageal vagal afferents.
Stimulus–response functions of mucosal (A, n = 6) and tension receptors (B, n = 9) to mucosal stroking and circumferential tension, respectively. The responses are before (•) and after exposure to NMDA (0.1 μm (○), 1 μm (▪) and 10 μm (□)). Stimulus–response functions of mucosal (C, n = 5) and tension receptors (D, n = 6) before (•) and after exposure to AP-5 (1 μm (▪) and 10 μm (□)). Asterisks indicate significant difference from control using a two-way ANOVA (**P < 0.01, ***P < 0.001).

