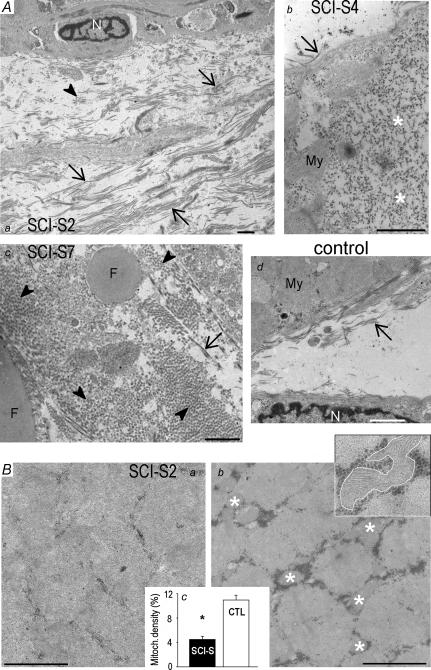
Figure 8. Ultrastructural remodelling in SCI-S muscles.
A, collagen accumulation and connective tissue expansion in spasticity. Representative electron micrographs of spastic (a, b and c) and control (d) human muscles. Images of SCI-S muscles are from three different patients. Note the extensive collagen depositions (a and c), lipid droplets (c), and replacement of myofibrils by amorphous material (b, asterisks) in spasticity. Arrows, collagen fibres in longitudinal section; arrowheads, collagen in cross-section; My, myofibrils; N, nucleus; F, fat (lipid) droplets. B, decreased mitochondrial volume density in spasticity. Typical electron micrographs of cross-sections obtained from spastic (a) and control (b) muscles. Some of the mitochondria are highlighted by asterisks. Inset in Bb: higher-magnification image showing encircled mitochondria. Bc demonstrates average mitochondrial area percentage relative to total area on micrographs of SCI (n = 4 muscles, 20 images) and CTL samples (n = 4 muscles, 20 images). Data are means ± s.e.m. * Significantly different at P < 0.05. All scale bars are 1 μm.

