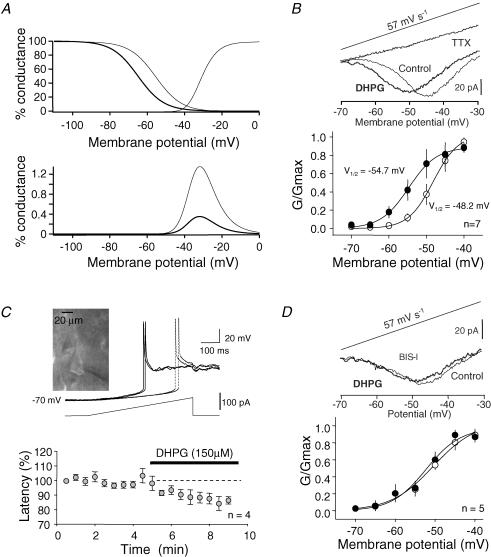
Figure 5. DHPG-induced regulation of INaP.
A, theoretical impact of the shift of the steady-state inactivation on the persistent sodium conductance (same model as in Fig. 4D). Upper graph, activation and inactivation curves. Lower graph, resulting window Na+ conductance in control (thin line) and after the −9.5 mV shift in the inactivation curve (thick line). B, regulation of INaP in acutely dissociated neurons evoked by a ramp of voltage (leak and capacitive currents were not subtracted). Upper panel, DHPG shifted the activation of INaP evoked by a slow ramp of voltage to more negative values. The current was totally blocked by TTX (1 μm). Bottom, INaP activation curve. Half-maximal activation of INaP was obtained for −48.2 mV in control (○) vs. −54.7 mV in the presence of DHPG (•). C, current-clamp recording in L5 pyramidal neurons. Single APs were evoked by a slow ramp of current in the presence of K+ and Ca2+ channel blockers. Application of DHPG decreased the AP latency. Bottom, plot of average (mean ± s.e.m.) normalized latency as a function of time. D, effect of DHPG on INaP in the presence of BIS-I (1 μm). Leak and capacitive currents were not subtracted. No shift in the activation of INaP was induced by DHPG (lower graph). (○) control (•) DHPG.

