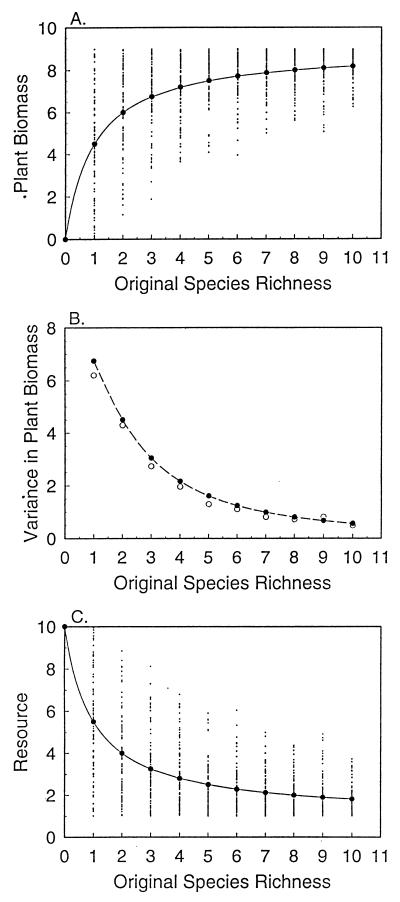
Figure 1.
Multispecies competition for a single resource. (A) Biomass increases with original species richness in simulations in which R* values for each of N species were drawn randomly from a uniform distribution on the interval [1, 10], and the best competitor among them (the lowest R*) identified. ·, the biomass of that best competitor, computed with a = 1, Q = 1, and S = 10, for each of 100 cases at each level of N. The solid curve and • were analytically calculated using Eq. 3. (B) Variance in biomass calculated from simulations (○) and analytically with Eq. 4 (•, curve) using parameters above. (C) Ambient level of resource remaining unused in the habitat versus original species richness. ·, resource levels for individual simulations and • and curve are predicted by Model 1.

