Figure 2.
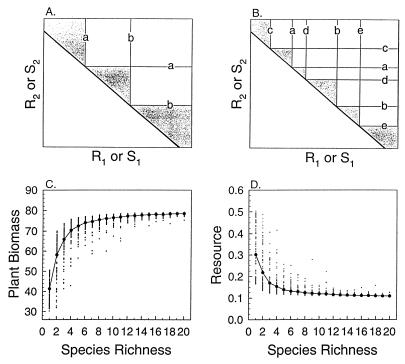
Competition for two resources. (A) Competition among two species (a and b) for two limiting essential resources (as in ref. 23). Curves labeled a and b are resource-dependent zero net-growth isoclines for species a and b. The thick diagonal line is the interspecific tradeoff curve, i.e., the lowest concentrations of the two resources for which any plant species can survive. Resources outside the tradeoff curve are potentially consumable. Shaded regions show unconsumed, but potentially consumable, resources. (B) A similar case, but with five species (labeled a–e). Note the greater resource use as indicated by the lower area (shaded) of unconsumed, but consumable, resources. (C) Results of simulations of the underlying analytical model (23) for a heterogeneous environment with 1000 different resource supply points and with N species drawn randomly from an unlimited pool of species with zero net-growth isoclines touching the tradeoff curve R*2 = 1/5 m R*1. ·, individual samples of N species; •, means of those samples. Each mean summarizes 100 samples; each sample averages across a heterogeneous habitat containing 1000 supply points in an elliptical cloud. (D) Levels of resource 2 occurring in simulations for C.

