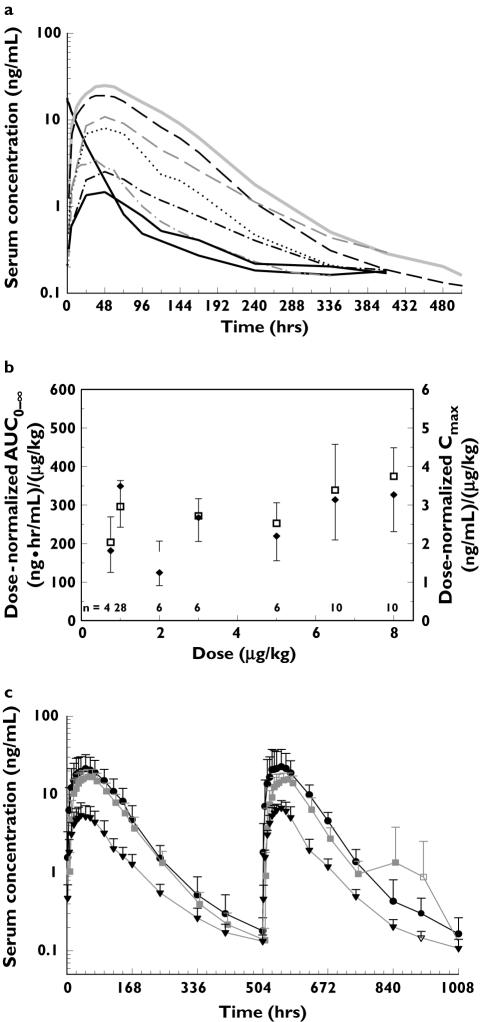
Figure 1.
Exploratory graphics analysis of data. (a) Mean of model development dataset serum darbepoetin alfa concentration profiles, 0.75 µg/kg SC, IV (n = 4) ( ), 8 µg/kg (n = 10) (
 ), 6.5 µg/kg (n = 10) (
 ), 5 µg/kg (n = 6) (
 ), 3 µg/kg (n = 6) (
 ), 2 µg/kg (n = 6) (
 ), 1 µg/kg (n = 28) (
 ), (b) change in exposure measured by dose-normalized AUC0–∞ (□) and Cmax (✦), along with the standard deviations and number of subjects are plotted against administered darbepoetin alfa s.c. dose; (c) mean (+ SD) of model evaluation dataset serum concentration–time profiles after first and second doses for selected dose groups. 500 µg (n = 4–10) (•), 6.5 µg/kg (n = 5–10) (
 ), 3 µg/kg (n = 5–10) (▾). n, Number of individual observations at each time point

