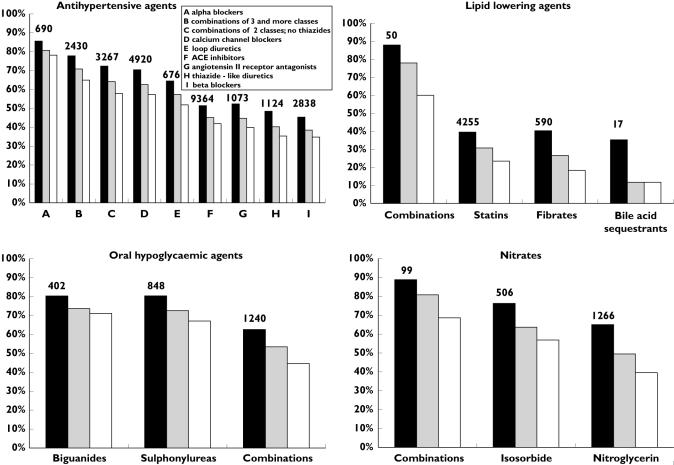
Figure 3.
Rates of coverage of patients already on treatment, by therapeutic regimen among the four therapeutic categories. Coverage is shown for each of the 3 years after the recruitment (black bars, first year; grey bars, second year; white bars, third year). The figures over the bars represent the number of patients at the time of recruitment

