
Figure 3.
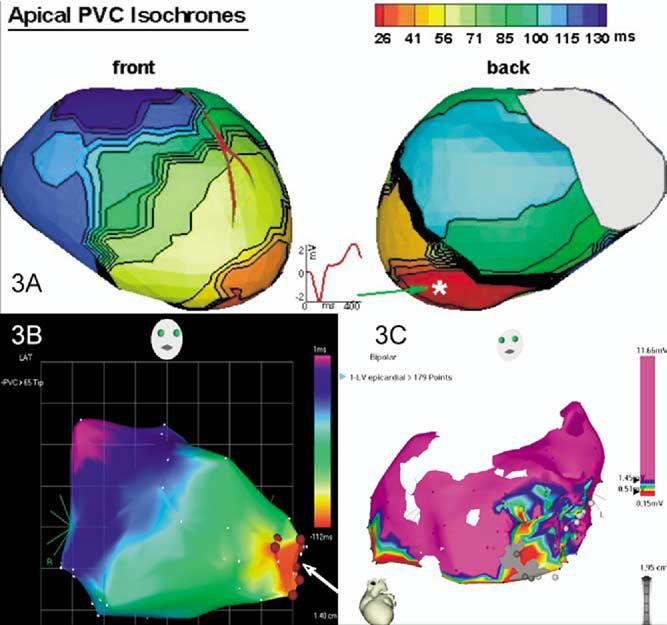
Comparison of three different modalities of mapping in this patient with focal VT. A Reconstructed activation map of a single PVC using noninvasive ECGI. A reconstructed epicardial electrogram from the PVC site of origin (asterisk) is also shown. B Endocardial activation map of the LV chamber using three-dimensional electroanatomic (CARTO) mapping of PVCs—right anterior oblique view. Ablation sites are shown (arrow). C Because of the infrequent PVCs, the epicardial map was obtained during sinus rhythm. All sites with a bipolar electrogram amplitude >1.45 mV are shown as purple. A low-amplitude region is present at the apex, including regions that are electrically unexcitable to pacing at 10 mA (2-ms pulse width). The gray circles are sites where pacing captured the phrenic nerve. Pace mapping in the low-voltage region produced a QRS morphology similar to that of the PVCs (not shown). Respective time scales are shown in panels A and B. Voltage scale is shown in panel C.