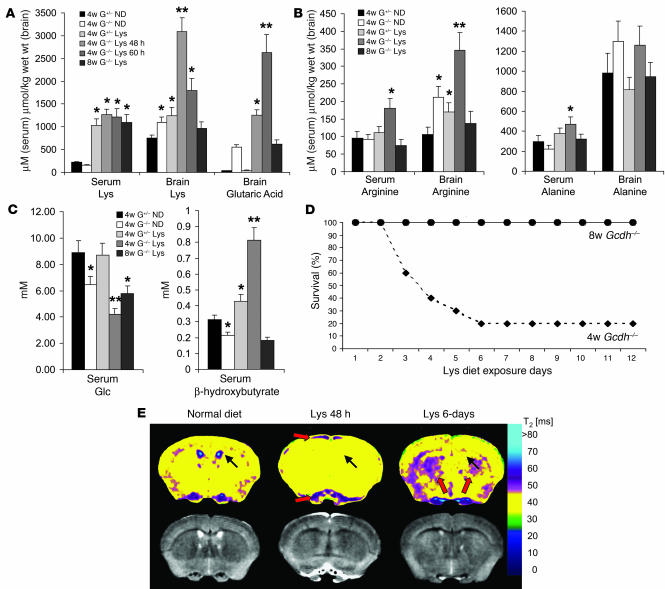
Figure 4. Brain lysine accumulation, ketotic hypoglycemia, and increased glutaric acid levels correlate with age-dependent susceptibility to brain injury in weanling Gcdh–/– mice.
(A) Serum lysine, brain lysine, and brain glutaric acid levels, (B) serum and brain arginine and alanine levels, and (C) serum glucose (Glc) and β-hydroxybutyrate levels in weanling (4w) and adult (8w) Gcdh–/– mice (G–/–) and heterozygous controls (G–/+) on normal (ND) or lysine (Lys) diets. Amino acid differences are compared with heterozygous normal diet controls, and brain glutaric acid differences are compared with weanling Gcdh–/– normal diet controls. Mean ± SEM, *P < 0.01; **P < 0.001. n = 6 each group. (D) Twelve-day survival of adult (black circles, n = 20) and weanling (black diamonds, n = 20) Gcdh–/– mice on the lysine diet. (E) T2 maps (top) and T2-weighted images (bottom) of weanling Gcdh–/– mice. Color bar indicates T2 values (right side). Weanlings showed brain swelling, indicated by obliterated ventricles (black arrows; compare left with middle and right), and increased subdural fluid collection (red arrows, middle) at 48 hours of lysine diet exposure. At 6 days, surviving weanlings developed striatal lesions indicated by increased T2 signal (red arrows, right).

