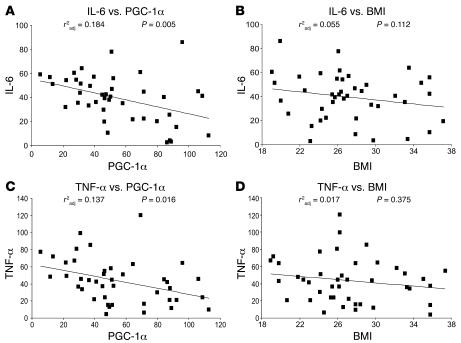
Figure 9. Correlation between PGC-1α and IL-6 gene expression in skeletal muscle of humans.
(A–D) Linear regression analysis of IL-6 and PGC-1α (PPARGC1A) gene expression (A), IL-6 gene expression and BMI (B), TNF-α and PGC-1α gene expression (C), and TNF-α gene expression and BMI (D) in skeletal muscle of 42 human volunteers. Adjusted r2 (r2adj) and P values are shown.

