


Fig. 13.
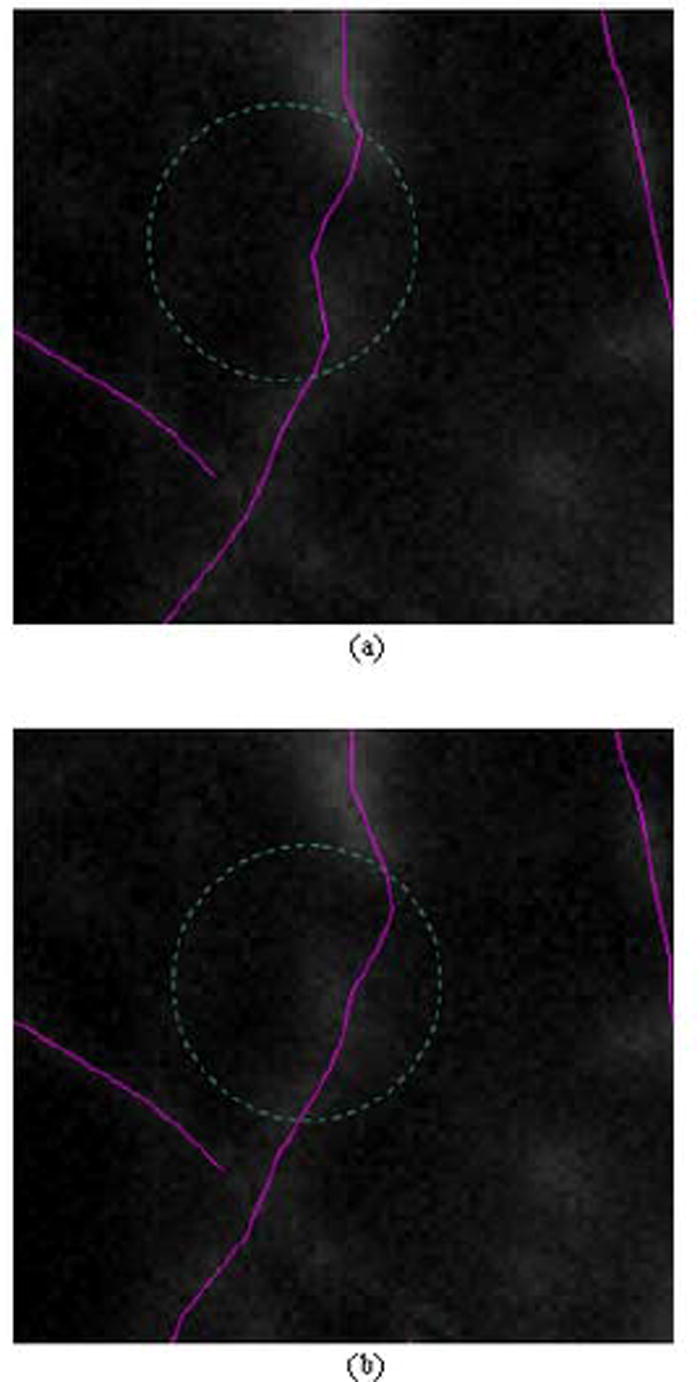
Comparison between extractions using different weight values for the cost function. A partial image is displayed with the extracted centerlines for the partial neurite segments are labeled in color. Note the difference of the lines within the two areas encircled by the dashed green circles. (a) extraction results forε = 1.0; (b) extraction results forε = 0.8