
Figure 4.
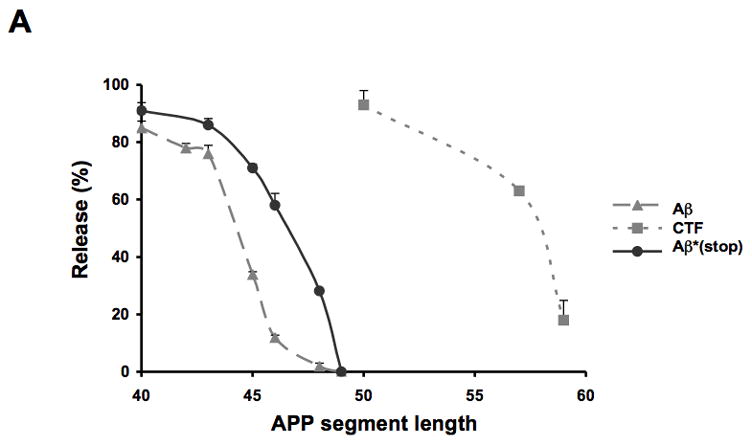
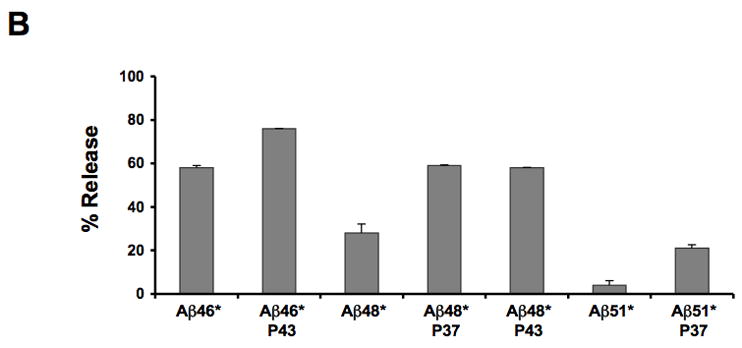
(A) Insertion of Aβ segments (grey dashed line, filled triangle), Aβ (stop) segments (black line, filled circles) and CTF segments (grey dashed line, filled squares) into the microsomal membrane. The percentage of molecules not integrated into the membrane (average and standard deviation of at least three independent experiments) is shown as a function of segment length. (B) Membrane integration of Aβ (stop) segments containing a proline residue in position 37 or 43. The percentage of molecules not retained in the membrane (average and standard deviation of at least two independent experiments) is shown.