
Figure 2. RS in the medial fusiform gyri modulated by motor-relevant properties of objects.
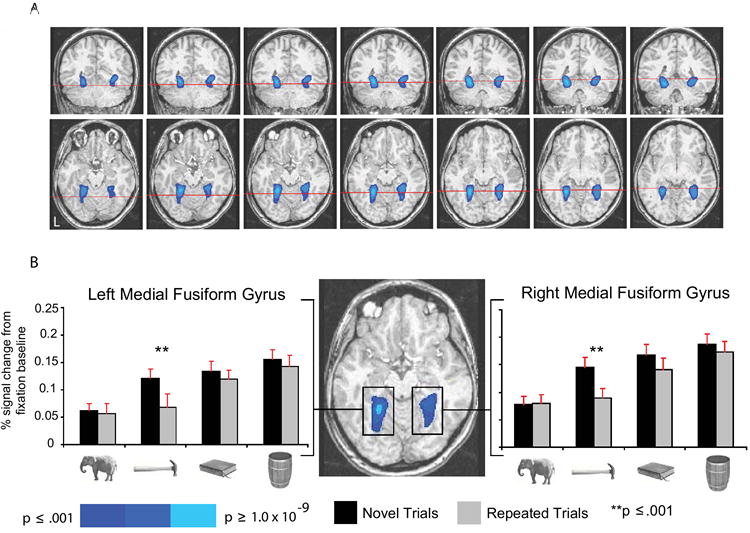
(A) The figure shows group averaged activity superimposed on the brain of an individual subject. Blue indicates regions in the medial fusiform gyri preferring nonliving things to animals (top row, left to right, y = -54 through y = -42, in steps of 2; bottom row, left to right, z = -16 through z = -4, in steps of 2). The red cross-sections in the top row indicate the plane of the axial slice directly below (and vice-versa). Voxels were defined at p < .001, corrected using family-wise error correction (Monte Carlo simulation), which takes into account cluster size and alpha level. (B) All histograms and statistical analyses of BOLD responses (here and elsewhere) were computed using mean BOLD responses by experimental condition, averaged across all voxels in the region. Error bars in all histograms of BOLD responses (here and elsewhere) represent the SEM. The peak differences for the contrast of nonliving things compared to animals were located (TT coordinates), in the left medial fusiform gyrus (8596mm3), at -24, -48, -8, and in the right medial fusiform gyrus (8264mm3), at 28, -41, -10 (figure shown at z = -12). There were main effects of RS bilaterally (ps < .005), collapsing across the four stimulus types. However, as depicted in the histograms, there was a systematic bias in RS toward ‘tools’ in the left medial fusiform gyrus, and toward ‘tools’ and arbitrarily manipulated objects in the right medial fusiform gyrus.