
Figure 8. Overlay of connectivity analyses and lesion overlap analyses.
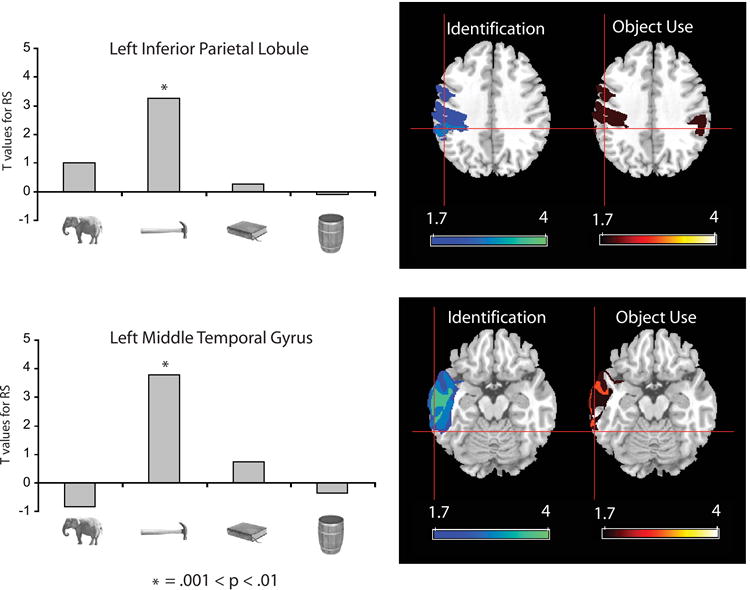
Functional connectivity analyses were conducted on the event related fMRI data. The seed voxel for this analysis was the peak response in the left medial fusiform gyrus showing greater activation for All Nonliving objects compared to animals. Voxels throughout the brain were then identified that showed a reliable correlation with the seed voxel in terms of stimulus-specific RS, separately for each of the stimulus types. Regions identified by this analysis included the left middle temporal gyrus (TT: -64, -47, -12) and the left inferior parietal cortex (TT: -51, -34, 36), both of which showed RS only for ‘tools’ (see Supplemental Table S8 for all regions identified by this analysis). The histograms represent the strength (t-values) of the RS effects in these regions for each stimulus type. Negative t-values indicate that the difference between novel and repeated trials (in e.g., the left middle temporal gyrus) was negatively correlated with the corresponding difference in the seed voxel in the left medial fusiform gyrus. The results of the functional connectivity analysis were then overlaid in Talairach space with the results of the lesion overlap analysis (see text and Figures 6 and 7). The axial slices (z = 36) in the top row show voxels in parietal cortex associated with impairments for identifying objects (left) and using objects (right). The axial slices (z = -12) in the bottom row show voxels in temporal cortex associated with impairments for identifying objects (left) and using objects (right). Color bars indicate z scores for lesion overlap calculated separately for each task. Cross-hairs on all slices show the locations in inferior parietal cortex (top) and lateral temporal cortex (bottom) that were identified through the functional connectivity analysis on the fMRI data. There is anatomical convergence between the two analyses. Together with the results displayed in Figure 7, these data demonstrate functional interactions between the left inferior parietal lobule, the left middle temporal gyrus, and the left medial fusiform gyrus.