
Figure 2.
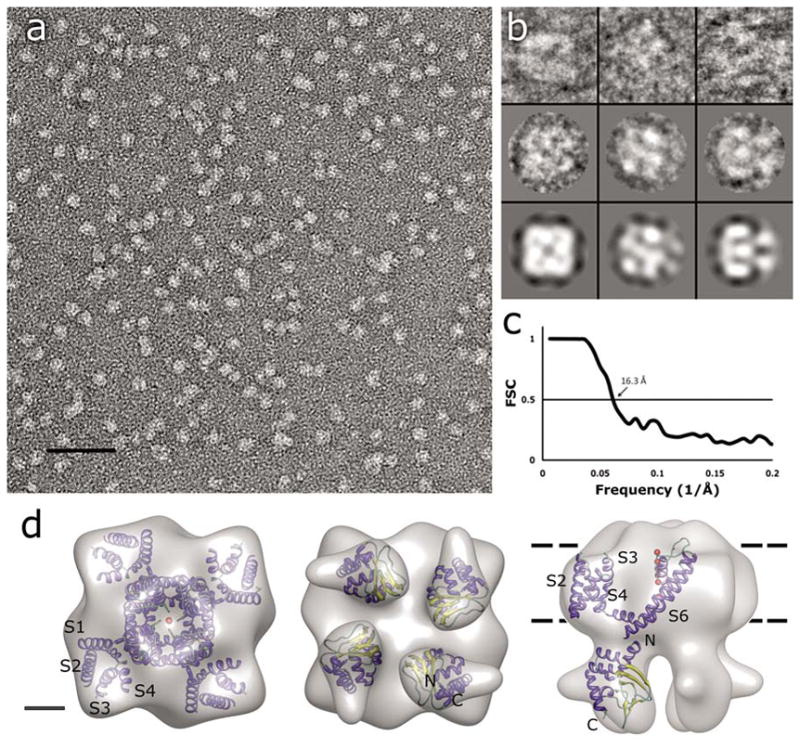
Single-particle TEM imaging of MloK1. (a) Electron micrograph of negatively-stained MloK1 particles. Detergent-solubilized MloK1 are bright on dark background. Scale bar 50 nm. (b) Selected class views and particle images of the MloK1 single particles. The first row is individual particle images from three classes in columns, the second row shows the corresponding class averages, and the last row is the p4-symmetrized 3D reconstruction density projected in the same direction. The width of the square panels is 16 nm. (c) Fourier-shell correlation (FSC) plot of the final 3D reconstruction, indicating a resolution of 16.3 Å (arrow, 0.5 criterion (Böttcher et al., 1997)). (d) The 3D reconstruction from 5018 single-particle images. Left, the proposed top-view from the extracellular side. Center, the bottom view, showing the four CNBDs. Right, the side view. The approximate membrane plane is indicated by the dotted lines. Scale bar 2 nm. Inside each density we show the docking of the high-resolution structures of Kv1.2 (PDB code: 2A79) and the MloK1 CNBD (PDB code: 1VP6) into the MloK1 3D reconstruction. The α-helices are in blue, β-strands in yellow, and loops in green. Red balls represent K ions in the pore.