
Figure 4.
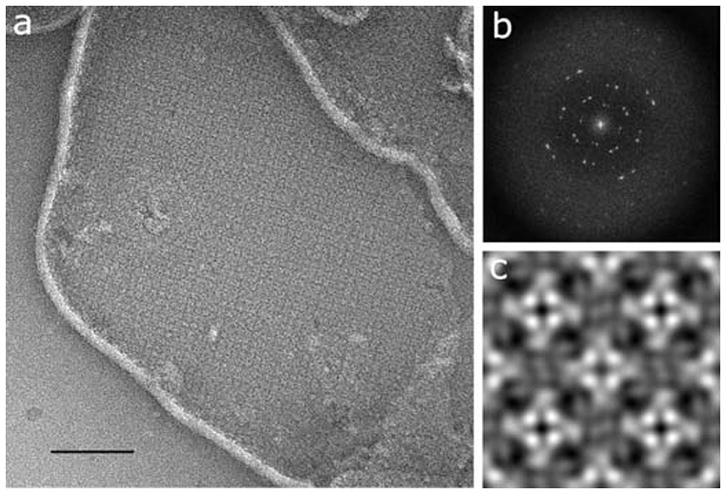
Two-dimensional membrane crystal of MloK1. (a) Electron micrograph of a negatively stained 2D crystal of membrane-reconstituted MloK1. The bright lines are the edges of the membrane crystals; the square lattice of the crystal is clearly visible. Scale bar 200 nm. (b) Typical calculated power spectrum, showing diffraction spots at 2 nm resolution before image processing. (c) The non-symmetrized reconstruction, showing 2×2 unit cells in p4212 symmetry. Unit cell dimensions are a=b=129Å, γ=90°. Protein is white in (a) and (c).