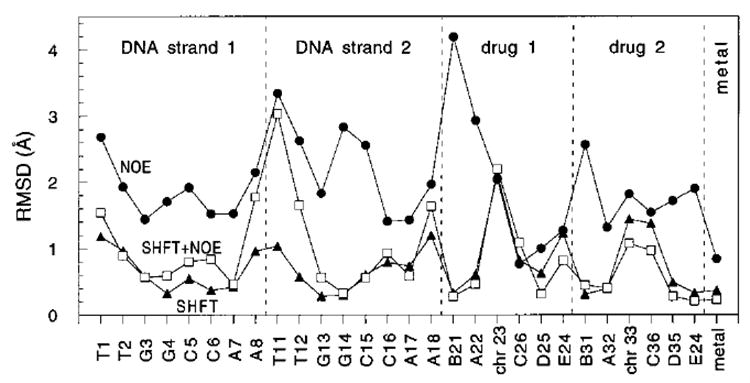
Figure 2.

Plot of the per residue pairwise average deviation of three averaged minimized structures derived from A, B, or P starting structures for the cases where NOE’s (●), pseudocontact shifts (▲), or both (□) were used in the simulations.

Plot of the per residue pairwise average deviation of three averaged minimized structures derived from A, B, or P starting structures for the cases where NOE’s (●), pseudocontact shifts (▲), or both (□) were used in the simulations.