
Figure 3.
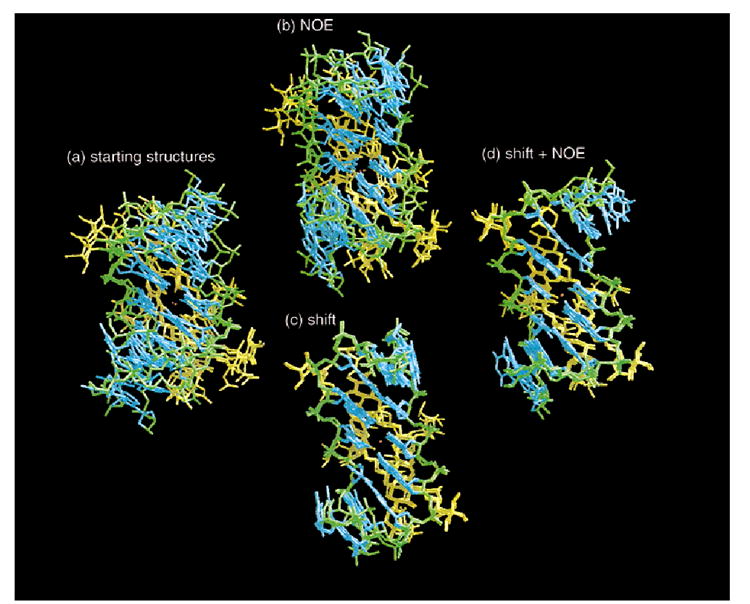
Superposition of three structures from each of the A, B, and P families, for (a) initial structures and (b–d) the three simulation conditions: (b) with NOE restraints, A_NOE, B_NOE, and P_NOE; (c) with pseudocontact shift restraints, A_SHFT, B_SHFT, and P_SHFT; and (d) with both shift and NOE restraints, A_SHFT_NOE, B_SHFT_NOE, and P_SHFT_NOE. The structures were superimposed at the central four DNA base pairs. The DNA backbone is shown in green, the DNA bases in cyan, and the two drug molecules in yellow. In b–d, minimized average structures from the full family of structures are shown.