Figure 4.

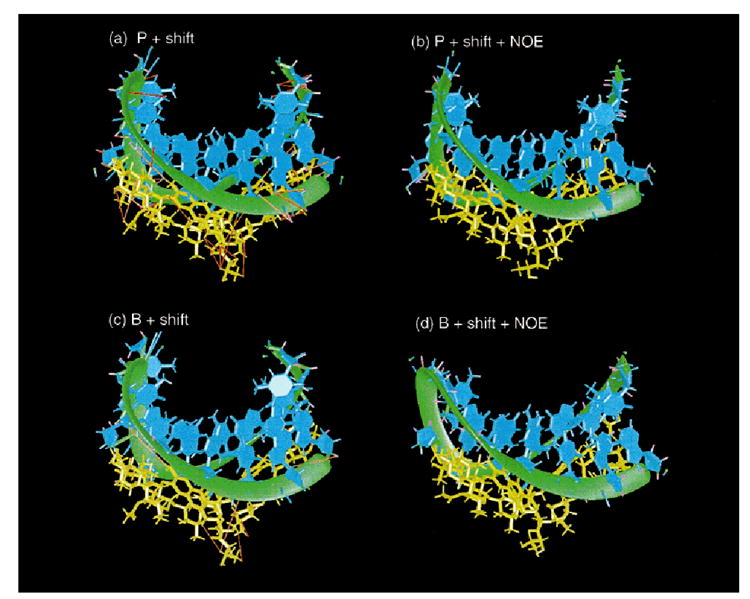
Pseudocontact shift (magenta) and NOE (red) violations shown on (a) P_SHFT, (b) P_SHFT_NOE, (c) B_SHFT, and (d) B_SHFT_NOE. The drug is shown in yellow, and the DNA is shown in green (backbone) and cyan (bases).

Pseudocontact shift (magenta) and NOE (red) violations shown on (a) P_SHFT, (b) P_SHFT_NOE, (c) B_SHFT, and (d) B_SHFT_NOE. The drug is shown in yellow, and the DNA is shown in green (backbone) and cyan (bases).