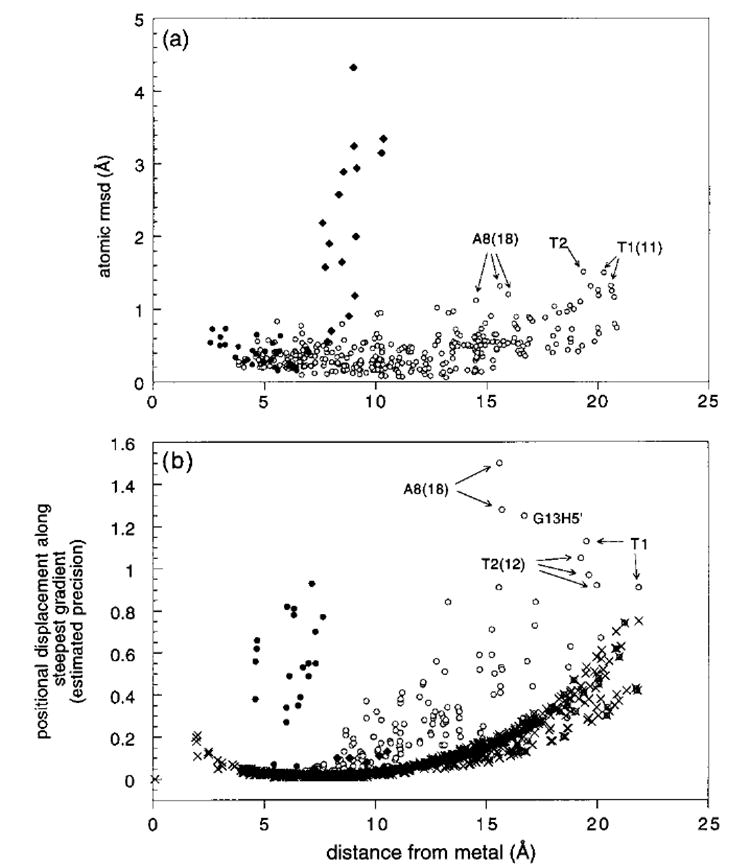
Figure 5.

(a) Plot of the atomic rmsd (excluding hydrogens) between the three minimized averaged structures A_SHFT, B_SHFT, and P_SHFT as a function of distance from the metal: ●, regions of the chromomycin that are involved in contact shifts; ♦, the chromophore side chain; and ○, the rest of the molecule. (b) Plot of the allowed positional displacement along the steepest gradient that would not cause or exceed an observed shift discrepancy ((δcalc-δobs-tol) > 0 (see text)) as a function of distance from the metal for the model P_SHFT. The plot shows the positional displacement calculated assuming no violations between experimental and observed shifts (×) and for the actual experimental result for P_SHFT (○,●,♦): ●, protons of the chromomycin that are involved in contact shift effects; ♦, protons of the chromophore side chain; and ○, all other protons and phosphorus nuclei. The least well-defined protons are identified individually.
