
Figure 6.
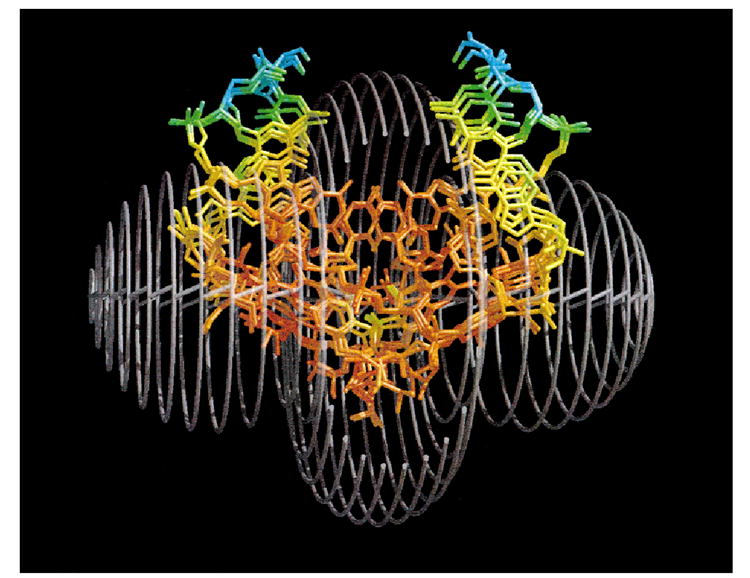
Superposition of A_SHFT, B_SHFT, and P_SHFT at the central 4 base pairs, shown in the cage of the susceptibility anisotropy tensor, drawn at a ± 1 ppm pseudocontact shift surface. The front of the tensor is cut off to show the molecules more clearly. The molecules are color coded for precision (see text). The red–blue color range depicts a range of estimated precision of 0–0.8 Å.