
Fig 1.
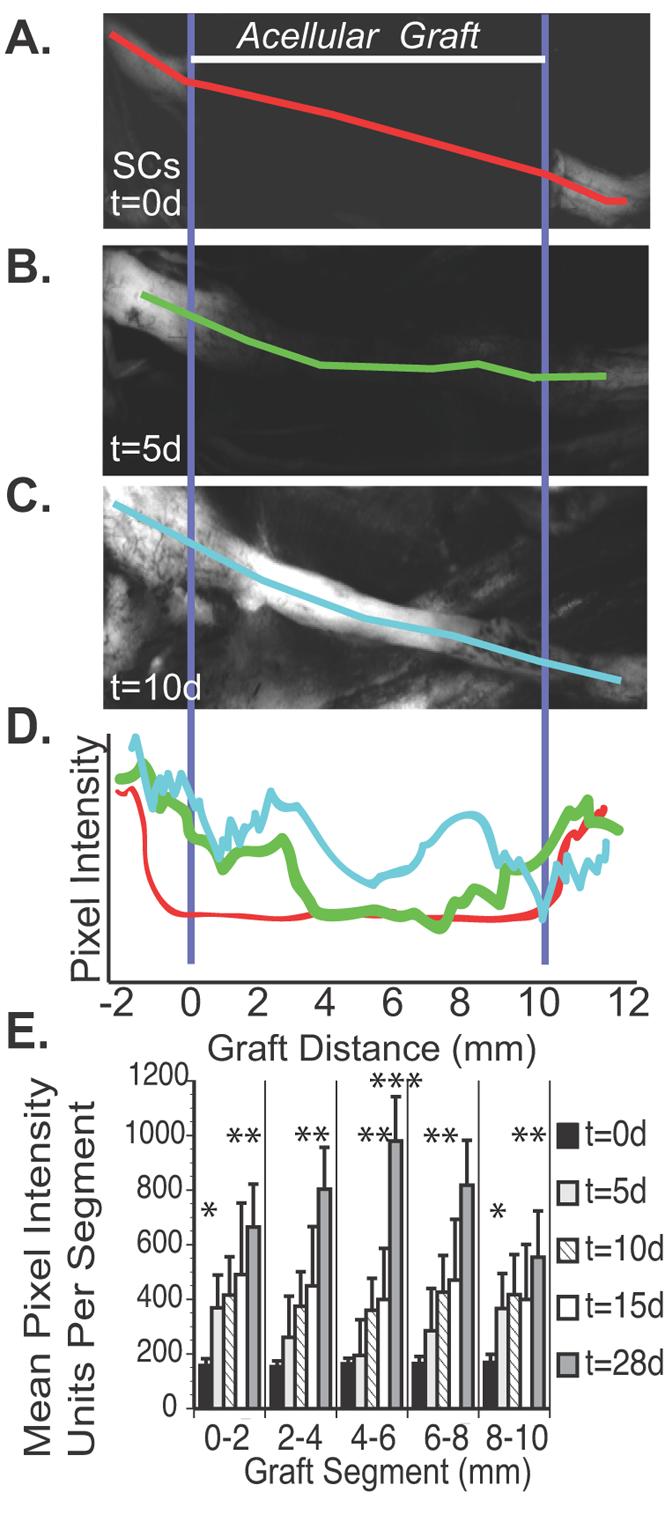
A. Representative sample of a 7 week cold preserved nerve allograft from a non-fluorescing Balb/C mouse transplanted into an S100-GFP mouse (n=8). Initially (t=0), there was no fluorescent emission within the graft, and it appeared black with low pixel intensity as noted by the red line scan. B. Five days later, fluorescent intensity had increased in the proximal and distal graft relative to the graft center represented by the green line. C. By 10 days, fluorescent intensity was noted throughout the graft as measured by the light blue line. D. A representative graph which quantifies fluorescent intensity for this particular mouse at t=0 days (red), t=5 days (green) and t=10 days (light blue) along the 10 mm long graft. A5. Twelve bit digitized images of the cold preserved nerve grafts are then divided into 2 mm segments and mean pixel intensity (0-4095) from these segments calculated up to 28 days post-engraftment. * The proximal and distal edges of the graft are significantly brighter 5 days after engraftment (p<0.05). ** At 28 days, all graft segments are significantly brighter than at 15 days (p<0.05). *** At 28 days, the central segment of the graft is significantly brighter than the graft edges (p<0.01).