
Figure 2.
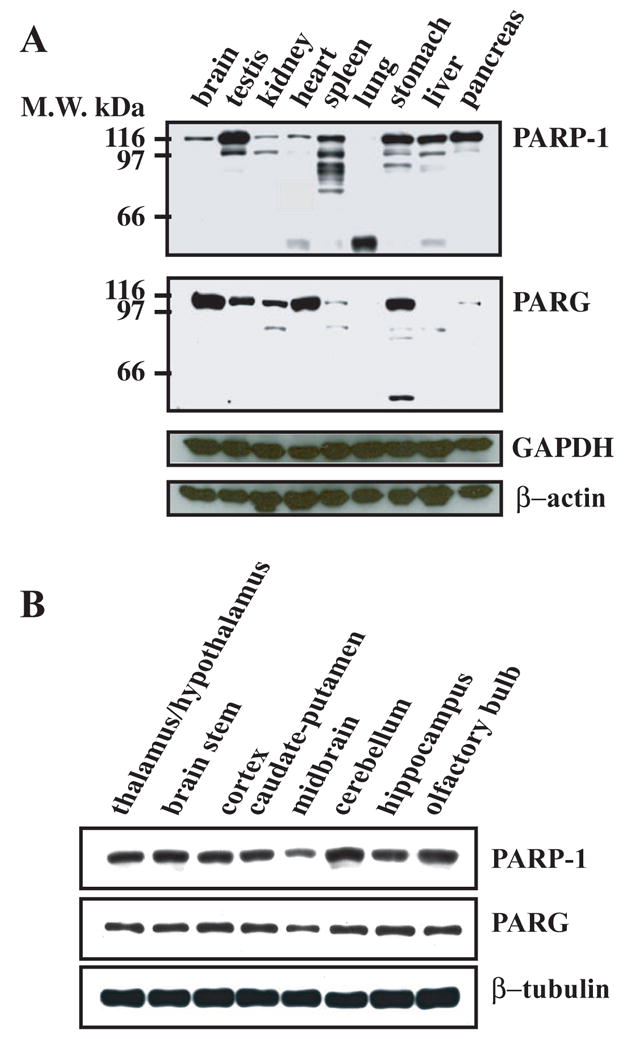
PARP-1 and PARG expression profile in rat tissues. CD1 rats were rapidly dissected and the different tissues and the different parts of the brain were homogenized in urea buffer. Proteins from the different samples (50 μg/well) were separated by SDS-PAGE, transferred to nitrocellulose membrane and blotted with affinity purified α–PARG antibodies (1 μg/ml), α–PARP-1 monoclonal antibodies 7D3-6 (0.5 μg/ml), monoclonal α–GAPDH antibodies (Santa Cruz), and polyclonal α–β-actin antibodies (Sigma). Western blots were developed by chemiluminescence using SuperSignal Pico reagent (Pierce). These results were replicated three times with similar results