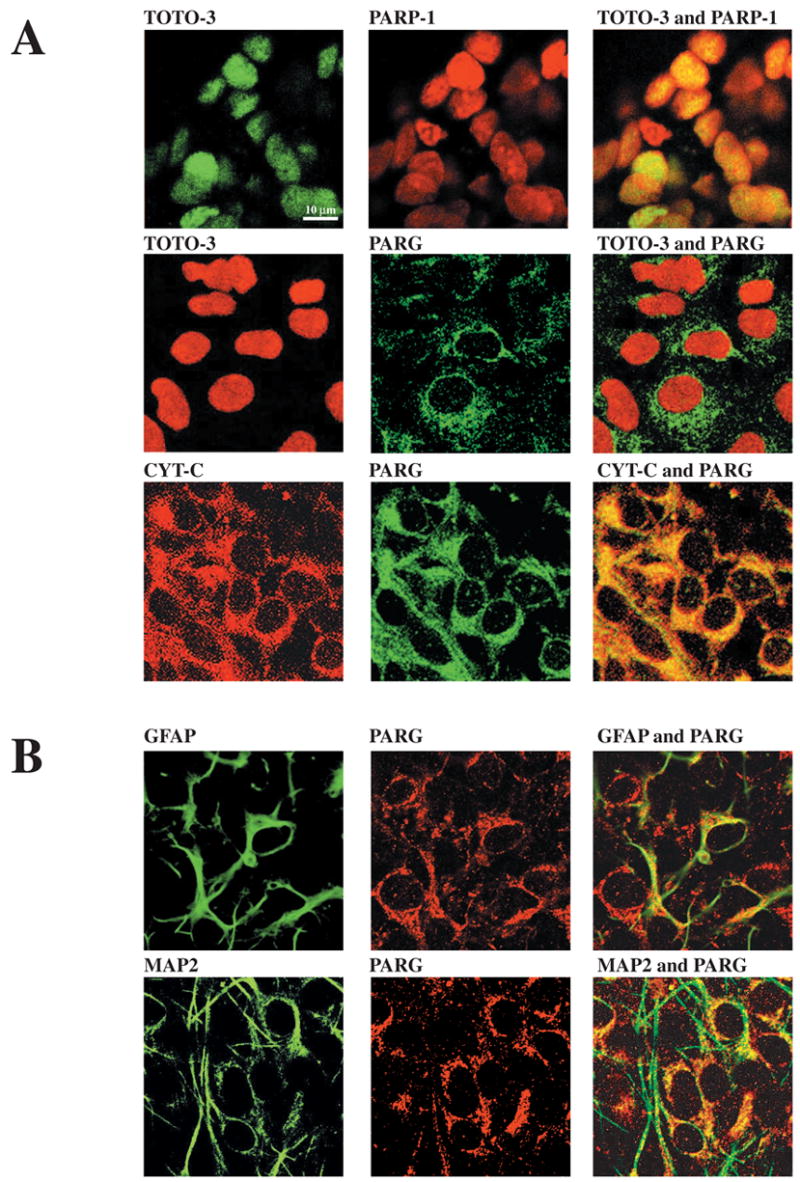
Figure 6.

Mutually exclusive cellular localization of PARP-1 and PARG. Confocal laser scanning microscopy analysis of PARP-1 and PARG in rat neuronal cortical cultures. Upper panels: Mixed neuronal cultures were stained with mouse α–PARP-1, α–Cyt C, rabbit α–PARG and with the DNA binding dye TOTO-3. Lower panels: Mixed neuronal cortical cultures were stained with rabbit α–PARG and mouse α–GFAP (glial marker) or α–MAP2 (neuronal marker). Confocal laser scanning microscopy shows that PARP-1 and PARG display a mutually exclusive cellular localization and that PARG is expressed in both neurons and astrocytes.
