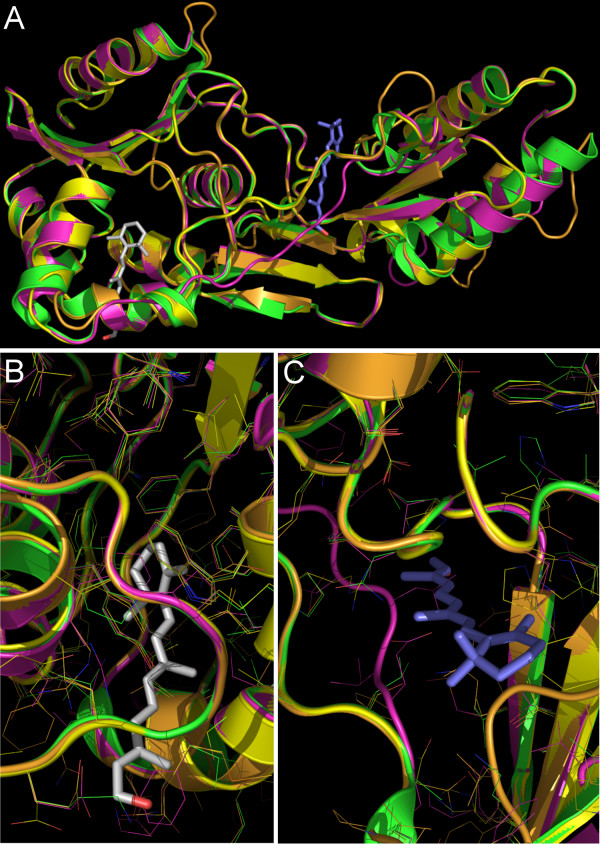
Figure 11.
Homology modeling of the modules of Xenopus IRBP. A) Superimposition of the predicted structures of X1-, X3- and X4IRBPs with the X-ray crystal structure of X2IRBP. Ribbon diagram: X1IRBP, orange; X2IRBP, green; X3IRBP, magenta; X4IRBP, yellow. Molecular docking studies predict two binding sites for all-trans retinol. The best scoring poses for the conformational search are shown with the retinol molecule colored grey in site I, and blue in site II. Close-up views of the docked all-trans retinol molecule in (B) site I, and (C) site II. All side chains are shown by thin lines in the colors of the backbones. The amino acid residues within contact distances to the ligand are tabulated in Table 5.

