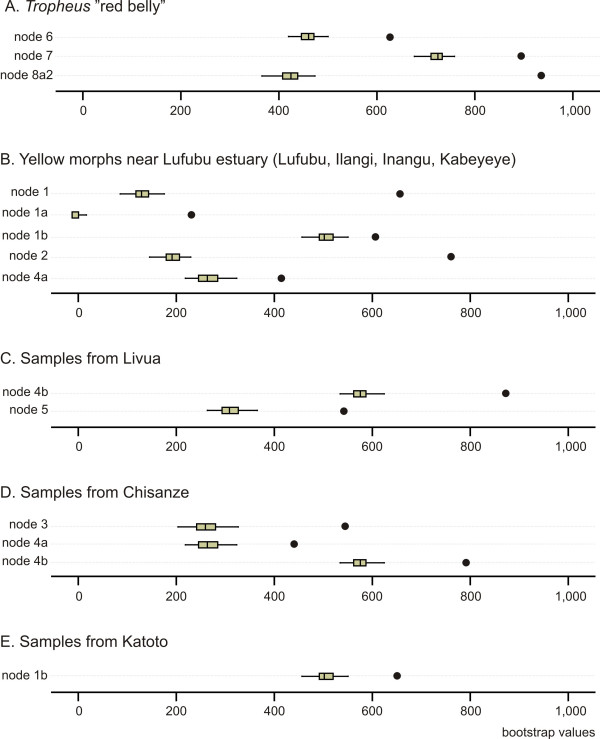
Figure 4.
Homoplasy excess test. Potential hybrid and introgressed taxa identified by the AFLP homoplasy excess test. The boxplots illustrate the distributions of bootstrap support values obtained in 53 taxon-reduced bootstrap analyses for nodes, which experienced a significant increase in bootstrap support (marked by solid circles) upon removal of the following taxa: A, Tropheus "red belly"; B, the yellow coloured morphs near the Lufubu River estuary (samples from Lufubu, Ilangi, Inangu and Kabeyeye); C, samples from Livua; D, samples from Chisanze; E, samples from Katoto. The nodes are identified in Fig. 3.

