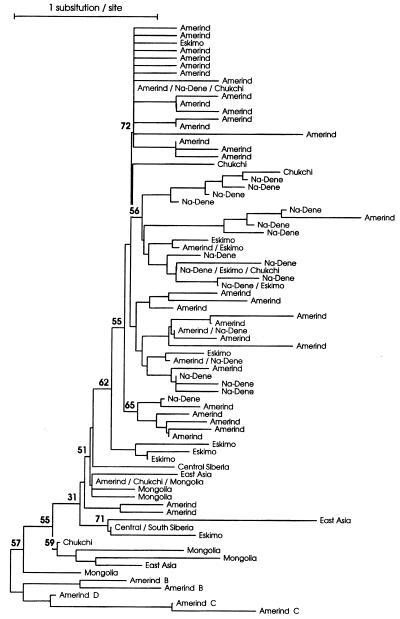
Figure 1.
NJ tree based on the p-distance for haplogroup A sequences from Native Americans and Asian populations, plus one representative of the other three haplogroups. Shared sequences have multiple labels. The number on the branches are confidence probability values (24).

