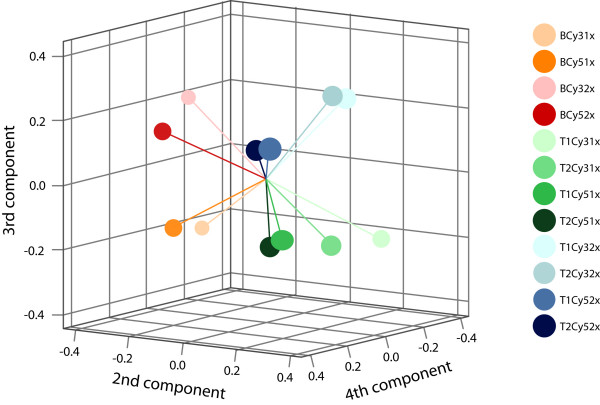
Figure 3.
Principal component analysis of 12 individual hybridizations. Each hybridization result is illustrated as a colored circle in a 3D graph. The similar the color, the similar the sample. The 2nd, 3rd and 4th components are demonstrated on the x-, y- and z-axis respectively with negative and positive values. The 2nd component explains differences in expression of tumor and bronchus (negative values (red-orange) are bronchus, positive values (blue-green) are tumor samples). The 3rd component explains the differences in number of amplification rounds (negative values (orange and green) are one round amplified, positive values (red and blue) are two rounds amplified) and the 4th component explains the labeling type of Cy-dye (negative values (light colored) are Cy3 labeled, positive values (dark colored) are Cy5 labeled samples).

