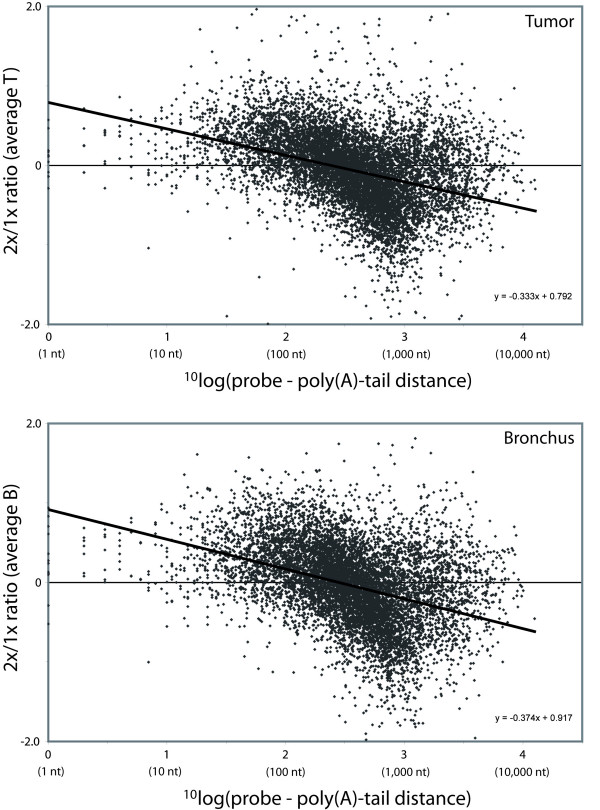
Figure 6.
Probe – poly(A)-tail distance in relation to overall signal intensity. For each of the 21,103 genes, the average signal intensity was calculated for one and two rounds of amplification for both sample types (T or B) separately. Per sample type, the average signal intensity after one round was subtracted from the average signal intensity after two rounds of amplification (2x/1x ratio). The 2x/1x ratios were plotted against the 10log of their corresponding probe – poly(A)-tail distance. A negative regression coefficient for both T and B samples was shown, significantly different from zero (p < 0.0001), that indicates a decrease in overall detection after two rounds of amplification with an increase in probe – poly(A)-tail distance. T, tumor; B, bronchus; 2x, two rounds of amplification; 1x, one round of amplification

