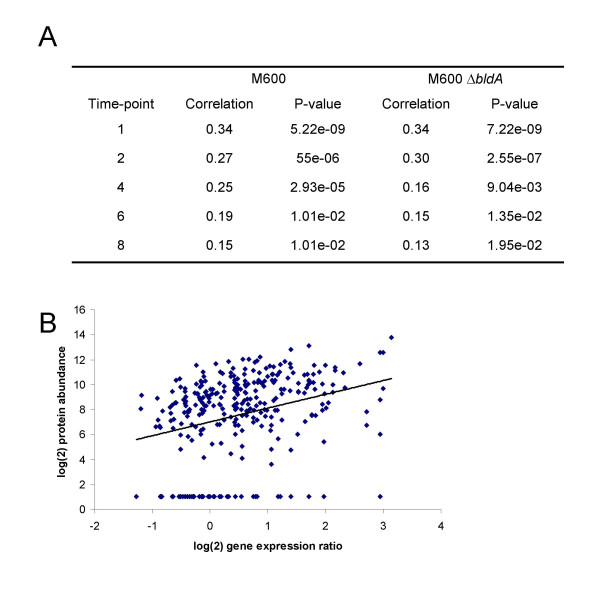
Figure 6.
Significant global correlation between protein and transcript abundance. (A) Table listing correlation coefficients and significance P-values characterising the relationship between protein and transcript abundance in liquid-grown cultures of M600 and M600 ΔbldA at different stages of growth. (B) Graph illustrating the positive correlation between protein and transcript abundance in strain M600 at the earliest timepoint.

