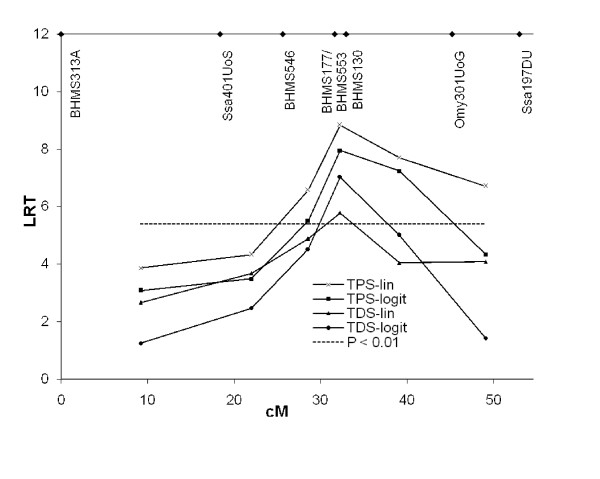
Figure 5.
Results from variance component analysis. TPS = Test Period Survival (binary data model); TDS = Test Day Survival (survival model); LRT = Likelihood-Ratio-Test statistic; cM = Kosambi centi-Morgan; lin = linear model was used; logit; Generalised Linear Model with a logit link function was used. Nominal significance level is shown as broken line. Marker positions are indicated at the top.

